CrashReporter on Mac: How to Use It to Troubleshoot Your Mac
If a Mac crashes, a simple restart will do the trick most of the time. But if the crashes are stagnant after frequent restarts, or they are occurring repeatedly, then there is a problem with your Mac.
Today we will look through the macOS Crash Reports to find out what is causing the crash issue and what you can do to resolve it. We will also brief you about where you can find these logs generated by CrashReporter on Mac.

Part 1. What Are macOS Crash Reporter Logs and Where Are They Saved?
The crash reporter in mac captures every information present about the crashed application or service in a .crash file, which can be of great help in diagnosing the problem later on. At first glance, the reports may seem pretty difficult to read and understand, but that's not the case. Once you know how to read the crash reporter logs, you can easily find everything about the error.
But before understanding the crash reports, let's first find where they are located in your Mac. Follow the steps mentioned below to find the reports made by crash reporter in Mac:
Step 1. Open the Applications page and find a folder named Utilities. Open it and find the Console.app there. Or you can open Spotlight and search for Console, open it and head to the next step.
Step 2. After you have successfully opened the console app, select the device on which the crash occurred from the top left corner of the window.
Step 3. All the reports are displayed there. Find the Crash Report with the correct date and time (when the application crashed). Open it.
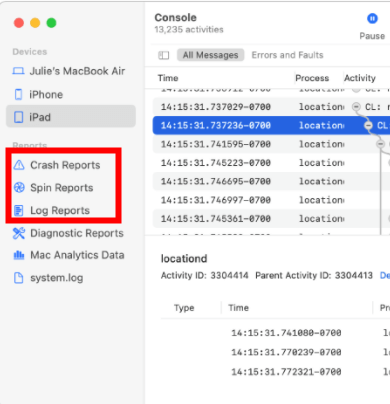
If you somehow are unable to find them using this method, you can try another one by following the steps mentioned below:
Step 1. Navigate to the finder tab.
Step 2. Press and hold the Option key and click on Go.
Step 3. From the list of options, find and open Library.
Step 4. Then open the Logs folder > Diagnostic Reports.
Step 5. Find the one which says .crash at the end.
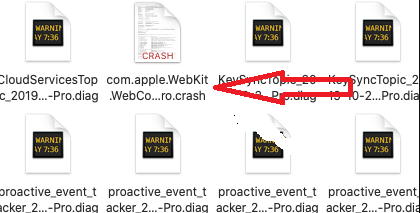
This way, you can have your report saved by the crash reporter of Mac. Now, let's proceed to the next part to find out how to read and understand these reports to solve the problem.
Part 2. How to Read MacOS Crash Reports to Troubleshoot Your Mac
Reading a report seems tricky, but after reading through the guide you will understand it in a breeze.
A crash report is usually pretty big to summarize, hence we will take a look through it section by section.
Section 1. The App Which Is Crashed
To separate the first section from the rest, you can highlight it from the first line of the report until it says User ID.
The only useful information this part gives us is about the crashing process, including the name, the path, the version, and the code type. Distinguish the app name from it and move to the next part.
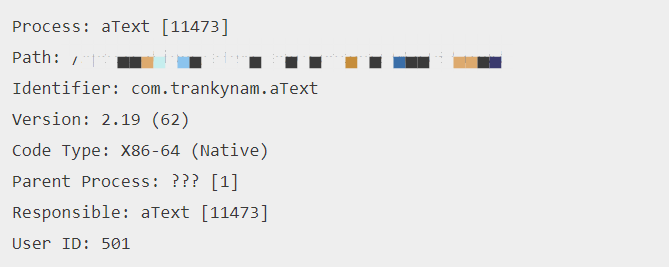
Section 2. The Time of the Crash
To separate the second part from the rest, you can highlight it from the line of Date/Time till Report Version.
Obviously, the second part tells about the date and time of the crash. Confirm this and move to the next part.
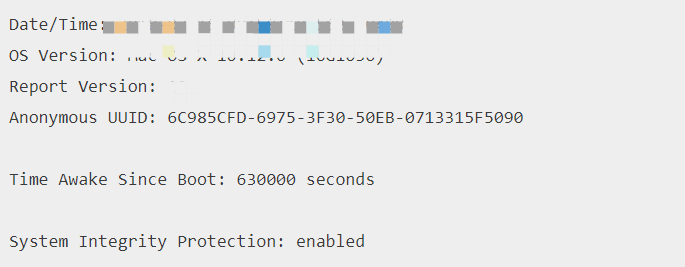
Section 3. The Cause of the Crash
Then the third part, look for three lines that start with Exception. This part shows the exceptions that making the crash happen in the first place. To understand these exceptions, you have to extract the Exception Type from the report first. To do so, look for the line with the same name to know about it.
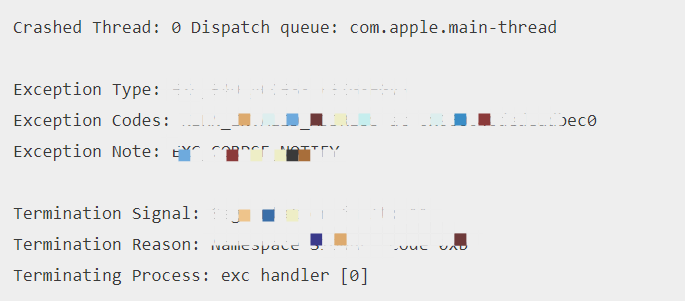
The most common exceptions and their explanations are listed below:
1. EXC_BAD_ACCESS/KERN_INVALID_ADDRESS
The reason behind this exception is that the application which crashed tried to access the unmapped memory. You can refer to the next section to solve it.
2. EXC_BAD_ACCESS/KERN_PROTECTION_FAILURE
When the application or its thread tries to write something on the read-only memory, this exception occurs.
3. EXC_BAD_INSTRUCTION
This exception occurs because the application or service requested something that the operating system couldn't understand or failed to fulfill.
4. EXC_ARTHMETIC/EXC_I386_DIV
This is because the application's code tried to divide an integer by the number zero but your Mac failed.
Section 4. Threads of the Crash
This part tells you the main cause of the crash. The threads allow users to finely see the cause of the crash and troubleshoot it using suitable methods.
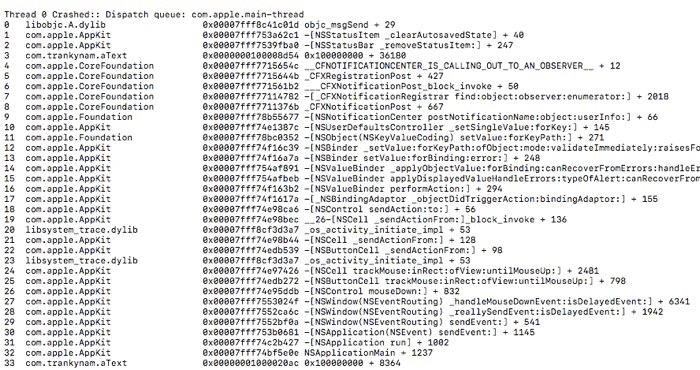
The Threads, if you are new to it, are nothing but the part of the programs running on your computer. For example, when you use PhotoShop and click the open file in it, then a thread of PhotoShop will be deployed to perform the task so that you can use your system and the application in the meantime. The working of threads is very important to keep the program running smoothly, and if any one of the threads crashes, the whole program dies with it.
The crash of threads can lead to the crash of the programs. So it's suggested to find the particular thread that caused the crash - read through the crash report from the section which starts with Thread.
Let's look at this crash report from cnet.com as an example.

The first you need to know is the order that the crash reporter writes a report, such as reverse chronological order. The reverse chronological order means that the item which occurred at the end will be written first, and the one which appeared first will be written at the end.
As in the example, you are seeing that thread 0 crashed, so it is the last process that occurred before closing the application. To get the cause of it, you can read the service which crashed was the DoFastCopyMap__FPUclPUcl4Rect - it is a process of an iMovie plugin, hence we know that the plugin of the software leads to the crash. To solve it, you can simply delete the plugin or clear its cache. It will be best to update the plugin or the software to the latest version to avoid errors.
To solve the particular problem in your case, you can google the phrase written after thread 0 crashed (which was DoFastCopyMap__FPUclPUcl4Rect in this case) and you will certainly get an answer to your problem.
Conclusion
Now that you know how to read the reports generated by the crash reporter on Mac, maybe you can extract useful information from the them. We hope that you can finally fix the crash issue and use the application normally again.
Time Limited Offer
for All Products
Not valid with other discount *

 Hard Drive Recovery
 Deleted Files Recovery
